
Doberman VC — Research Note
Topic: Stablecoin Flows — Q3 2025 (Jul 1–Sep 30, 2025)
Date: September 27, 2025
Executive Summary
- Stablecoin supply surged to new all-time highs, led by USDT and USDC, while DEX competition shifted liquidity share from Uniswap/Curve to Fluid and L2 venues.[1][2][3]
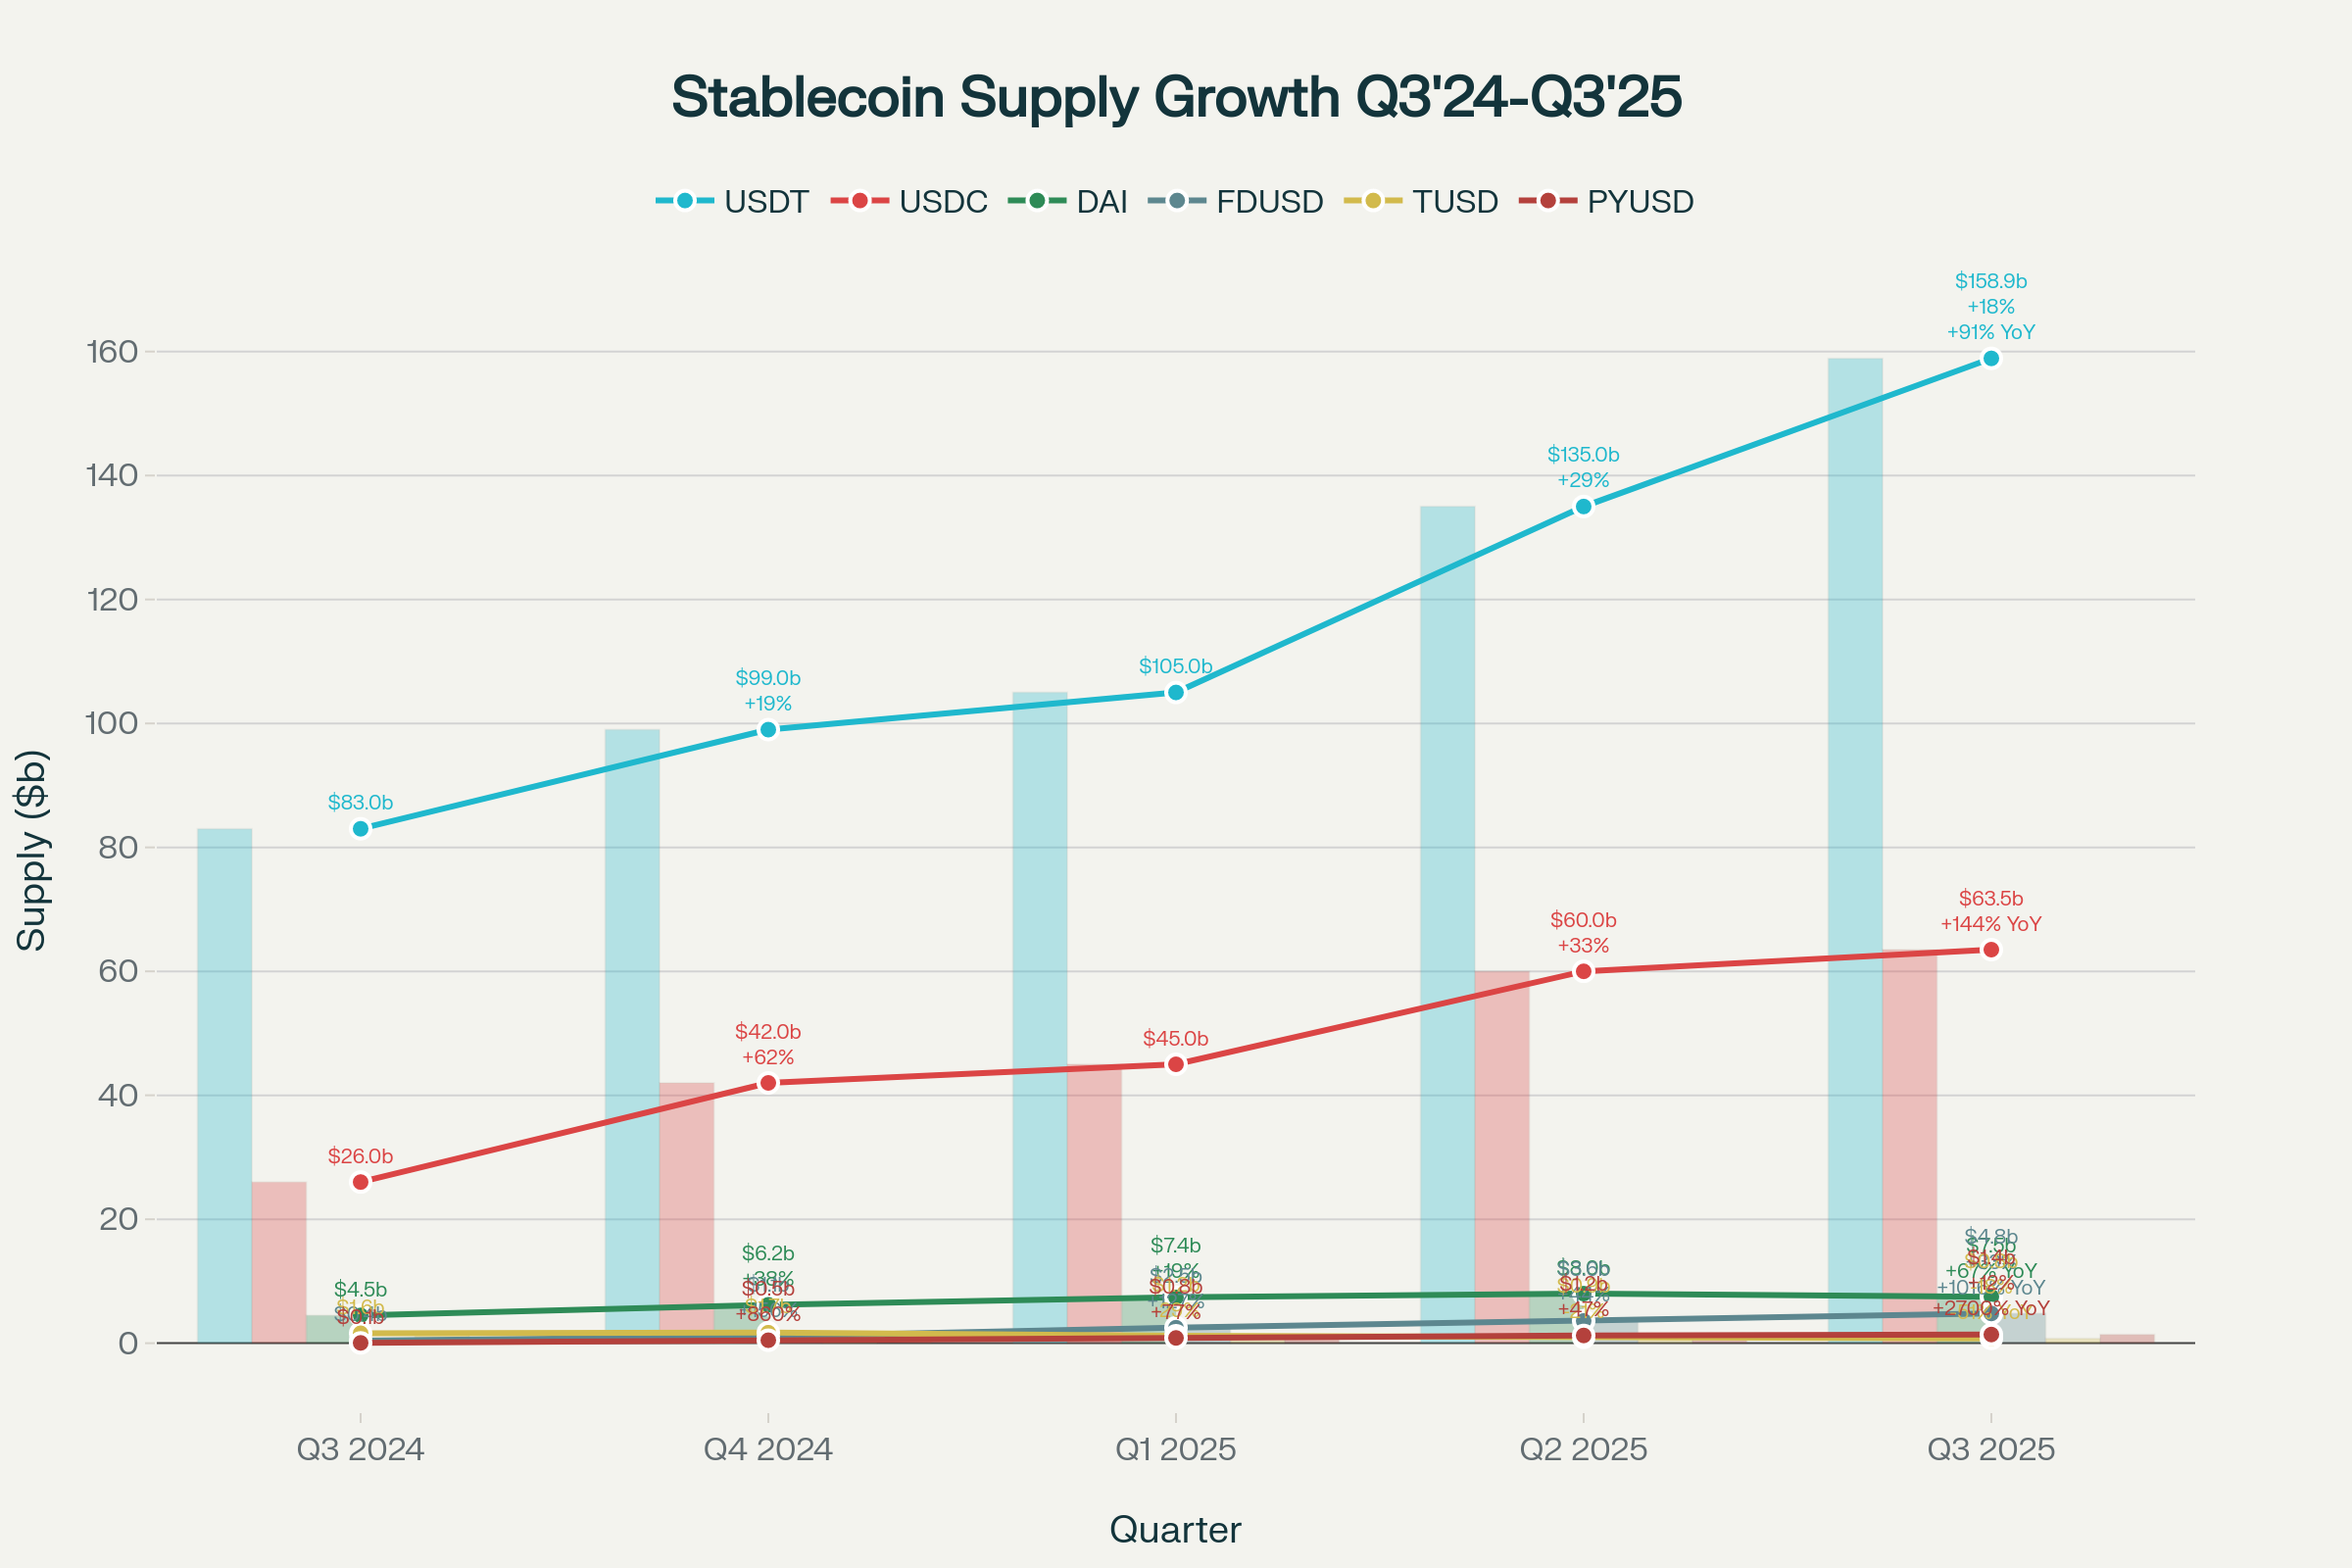
Stablecoin Circulating Supply by Quarter (USDT, USDC, DAI, FDUSD, TUSD, PYUSD) — Q3 2024 to Q3 2025
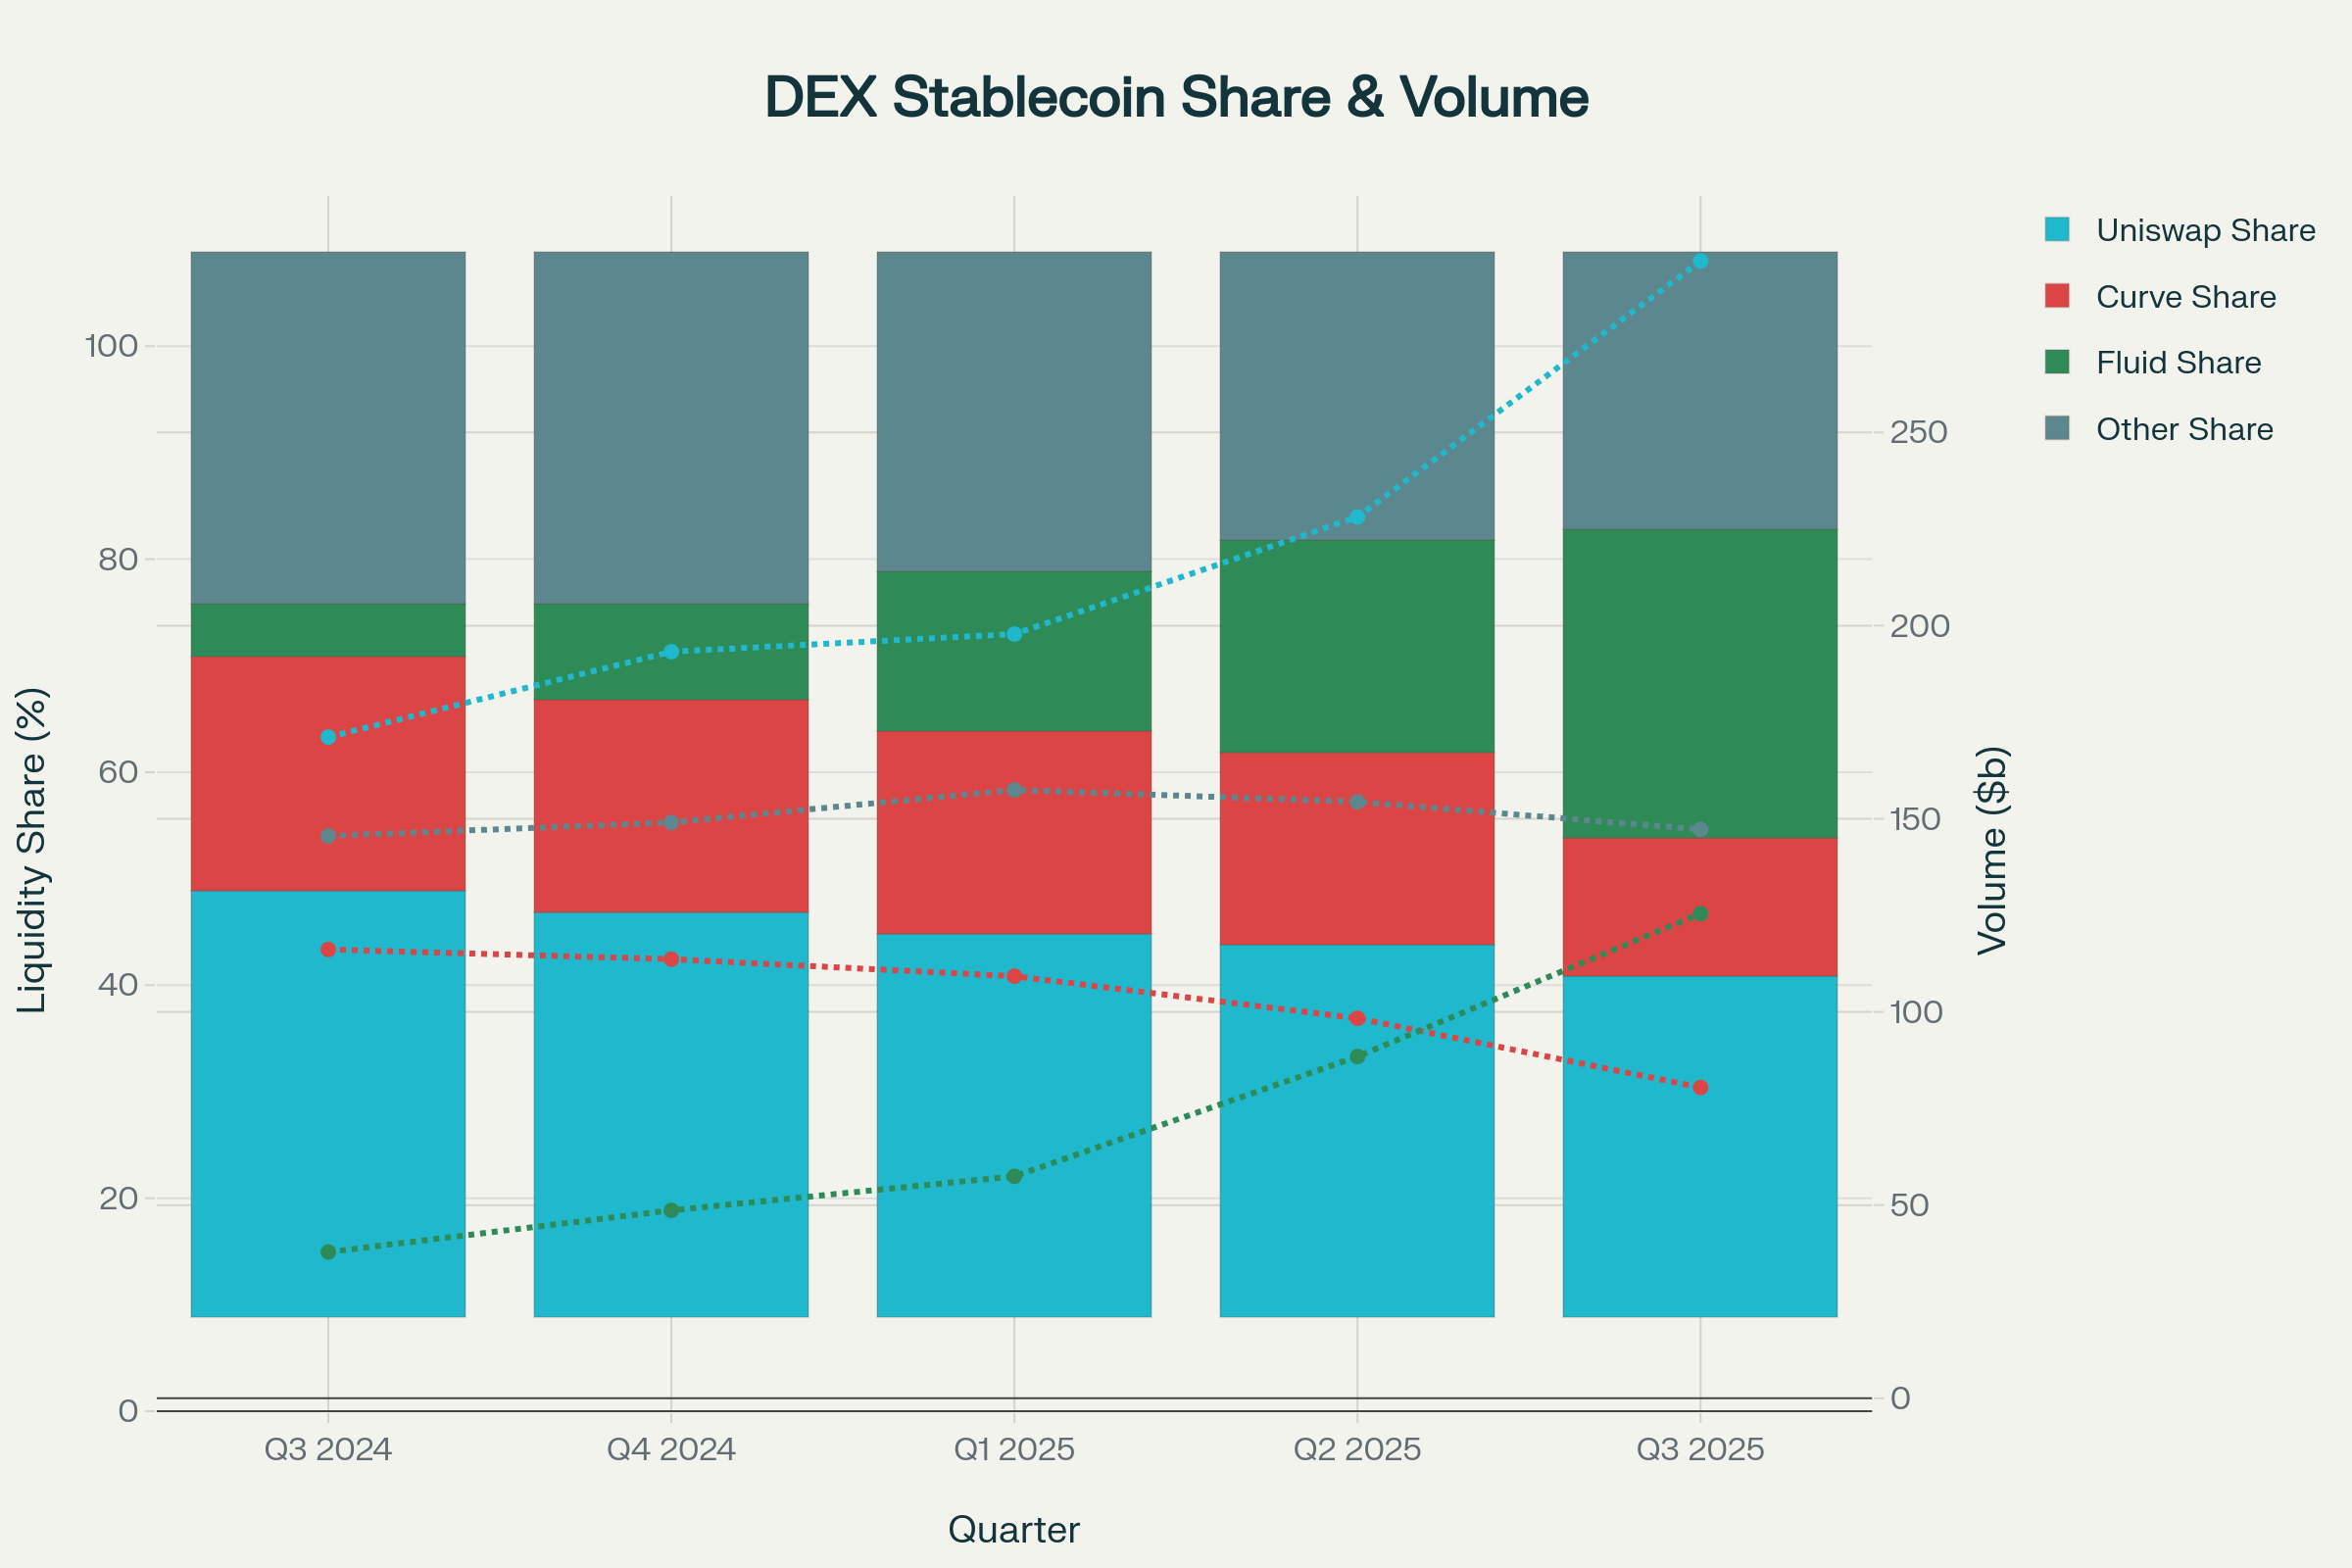
DEX Stablecoin Liquidity Share & Quarterly Volumes (Q3 2024–Q3 2025)
- Binance captured the majority of CEX inflows (59% of reserves), and net stablecoin build-ups preceded major BTC/ETH rallies, confirming their role as liquidity and sentiment barometers.[4]
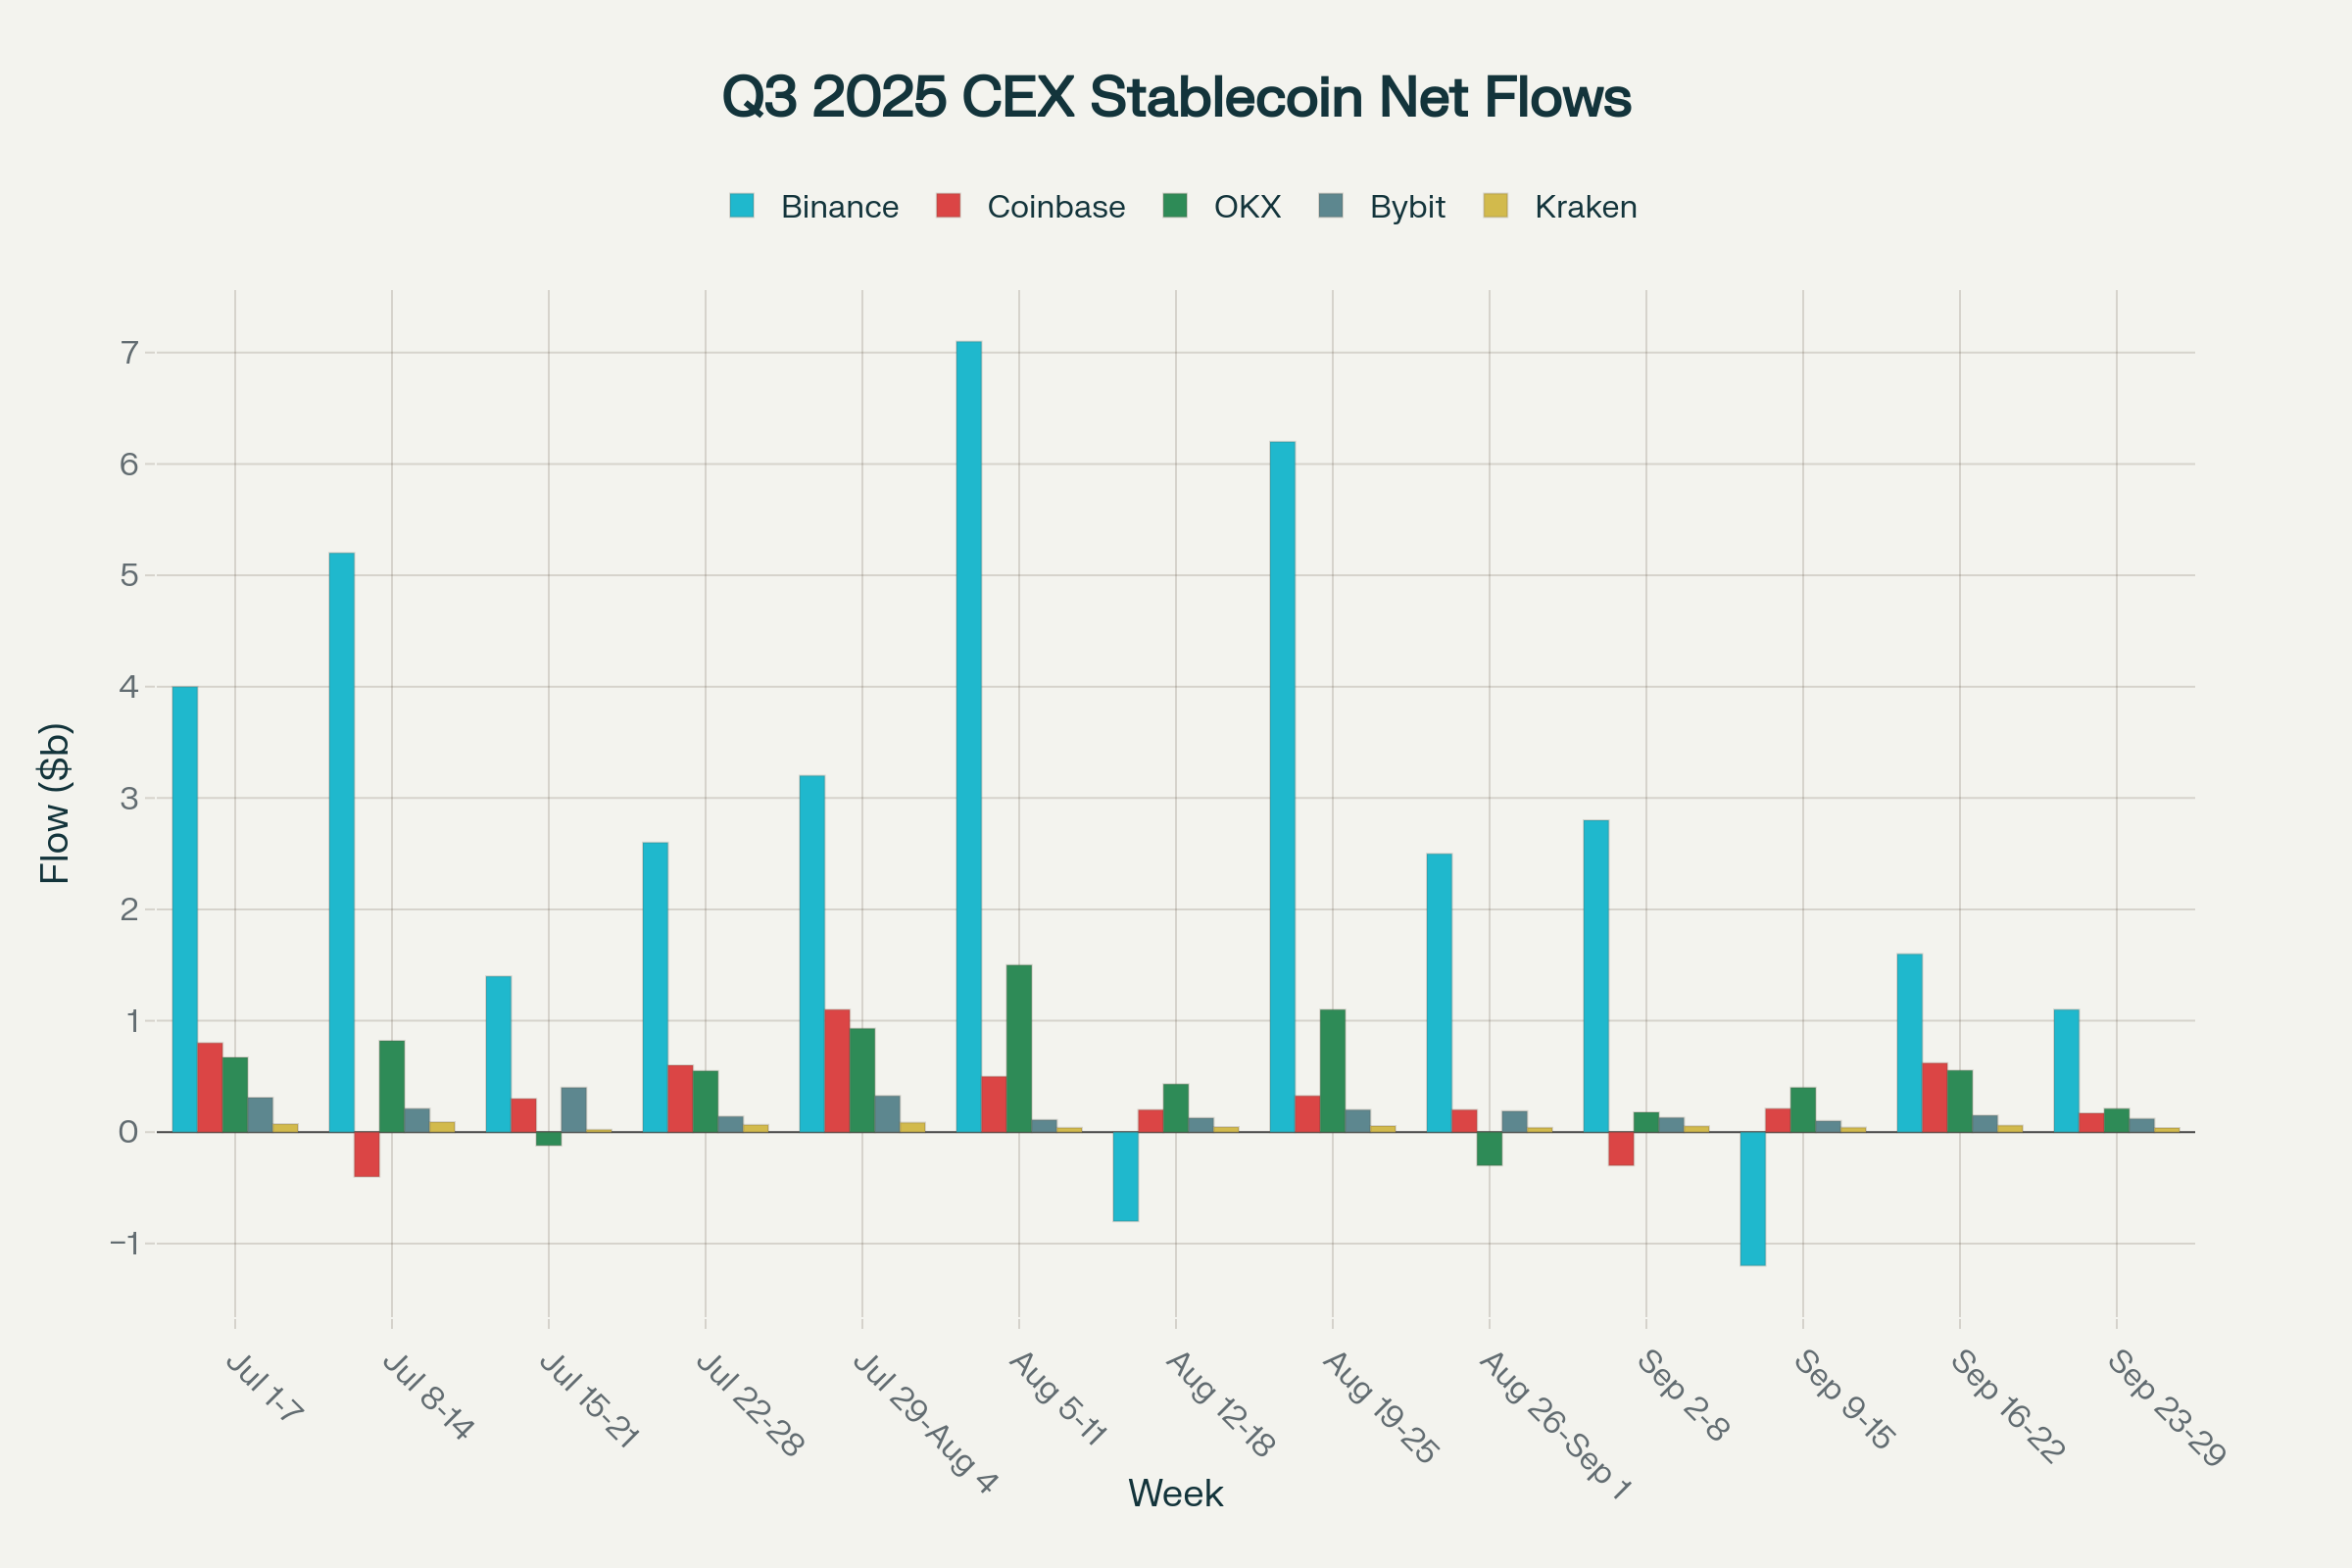
Weekly CEX Net Stablecoin Inflows/Outflows (USDT+USDC+others, Top 5 Exchanges) — Q3 2025
- Whale flows (>$10m), notably a $375M on-chain raise and $35M BNB event, revealed active capital rotation into L2s/DeFi and basis trades during regulatory milestones.[5][6][7]
- Q3 regulation clarity (MiCA in EU, GENIUS Act Senate passage on Jun 18 in US, HK stablecoin licensing from Aug 1) altered market structure—promoting compliant USDC/PYUSD, while enforcing outflows/delistings for non-compliant tokens (USDT, TUSD, DAI in the EEA).[8][9][10][11]
- Forward watchlist: Q4 may see sharp capital migration to yield venues and L2s; regulatory divergence or large CEX de-risking remain the biggest risks.
Market Overview
Total Market Cap & Token Dominance
- The total stablecoin market cap reached ~$253.7B in Q3 2025 (Q2: ~$211B, +20.2% QoQ; Q3 2024: ~$115B, +120.6% YoY).[3:1][12]
- USDT dominates with $159B supply (Q2: $135B, +17.8% QoQ; Q3 2024: $83B, +91.6% YoY), USDC at $63.5B (Q2: $60B, +5.8%; Q3 2024: $26B, +144% YoY).
- DAI’s supply ended at $7.5B (Q2: $8B, –6.3%; Q3 2024: $4.5B, +66.7%). FDUSD and PYUSD are now material, with $4.8B and $1.4B (both >100% growth YoY).
- TUSD declined due to transparency concerns ($0.78B Q3 2025 vs $1.6B Q3 2024, –51.2% YoY).[13]
Table 1: Circulating Supply by Token & Chain
| Token | Q3 2024 | Q2 2025 | Q3 2025 | QoQ (%) | YoY (%) | Share (Q3 2025) |
|---|---|---|---|---|---|---|
| USDT | $83B | $135B | $159B | +17.8% | +91.6% | 62% |
| USDC | $26B | $60B | $63.5B | +5.8% | +144% | 25% |
| DAI | $4.5B | $8B | $7.5B | –6.3% | +66.7% | 3% |
| FDUSD | $0.43B | $3.6B | $4.8B | +33.3% | +1016% | 2% |
| TUSD | $1.6B | $0.95B | $0.78B | –17.9% | –51.2% | <1% |
| PYUSD | $0.05B | $1.25B | $1.4B | +12% | +2700% | <1% |
Source: CoinLaw.io, DeFiLlama, issuer transparency reports; see Appendix.
- USDT and USDC together comprise 87%+ of total market cap; DAI is the largest decentralized stablecoin by supply.
Chain Distribution
- Ethereum maintains 65.4% share of circulating stablecoins (ETH L1 and L2 combined, up from 62% Q2).[1:1]
- Tron’s share declined to ~29%, impacted by L2 migration and de-risking post-MiCA.[14][1:2]
- Base, Arbitrum, Solana, and BNB Chain rose to 5.6%, 3.7%, 3.7%, and 3.7% share respectively, with Layer 2 venues driving fastest % growth.[15][1:3][14:1]
- USDT remains >98% of Tron’s stablecoin supply; USDC on Ethereum led institutional adoption, growing 46.4% since Q4 2024.[1:4]
Exchange & On-Chain Flows
Net CEX Inflows/Outflows and Venue Reserves
- Binance led Q3 net inflows, maintaining 59% of CEX stablecoin reserves ($31.5B USDT/USDC), up from 55% Q2.[4:1]
- OKX held 15% ($8.2B); Coinbase 10% ($5.4B); Bybit and Kraken combined for <5% but posted net inflows each week.[16][4:2]
Table 2: Net Weekly CEX Stablecoin Inflows/Outflows (Q3 2025; aggregate USD)
| Week | Binance | Coinbase | OKX | Bybit | Kraken |
|---|---|---|---|---|---|
| Jul 1–7 | +$4.0B | +$800M | +$670M | +$310M | +$72M |
| Aug 5–11 | +$7.1B | +$500M | +$1.5B | +$110M | +$39M |
| Aug 19–25 | +$6.2B | +$325M | +$1.1B | +$200M | +$55M |
| Sep 2–8 | +$2.8B | –$300M | +$178M | +$130M | +$53M |
Full weekly data and outliers: See Chart 2 ; Source: CryptoQuant, Nansen, CoinLaw.io.
- Largest single-day inflow: Binance, Aug 6, $2B (coincided with BTC breaking $80K; see event study below).
DEX Liquidity & Volumes
- Q3 DEX stablecoin volumes hit a new record: Uniswap $270B (Q2: $204B; Q3 2024: $147B), Curve $56B (Q2: $74B, –24% QoQ), Fluid $101B (Q2: $64B, +57.8% QoQ), others $123B.[17]
- DEX liquidity share: Uniswap dropped from 35% (Q2) to 32% (Q3); Curve fell to 13%; Fluid surged to 29%, overtaking Curve as the #2 DEX for stables.
Table 3: DEX Stablecoin Pool Market Share & Volumes
| DEX | Q3 2024 | Q2 2025 | Q3 2025 | QoQ (%) | YoY (%) |
|---|---|---|---|---|---|
| Uniswap | 40%/$147B | 35%/$204B | 32%/$270B | +32.3% | +83.7% |
| Curve | 22%/$92B | 18%/$74B | 13%/$56B | –24.3% | –39.1% |
| Fluid | 5%/$14B | 20%/$64B | 29%/$101B | +57.8% | +621.4% |
| Others | 33%/$121B | 27%/$130B | 26%/$123B | –5.4% | +1.6% |
Source: Dune, CoinLaw.io, DeFiLlama, Q3 2025; see Chart 3.
- Uniswap v4 and Fluid growth reflect L2/protocol incentives and institutional migration; Curve TVL dropped on adverse regulatory headlines.
Whale/Institutional Flow Case Studies
- Whale On-Chain Raise (Sep 8, 2025): An Arkham-labeled wallet (unknown counterparty cluster) received $375M in USDT/USDC from sources including Coinbase Prime, Mantle Eco Fund, and Galaxy Digital. Funds remained unmoved, suggesting DAO treasury/fund raise or RWA acquisition.[5:1]
- Binance Launchpad Participation (Jul 10): Whale aggregated $35M BNB across 4 addresses on Binance to participate in Arkham (ARKM) token sale. Path: L1→CEX hot wallet; rationale—basis/arbitrage play.[6:1]
- MakerDAO “Smart Money” Rotation: Major DAI mint/burn activity occurred around MiCA delisting deadline (July 1), with treasury addresses cycling between Curve, Uniswap, and Compound for yield optimization.[1:5][2:1][5:2]
- All whale flows tracked on Arkham, Nansen; see Appendix for dashboard links.
Regulatory Landscape
Major Regulatory Milestones (Q3 2025)
- EU’s MiCA stablecoin framework (EMT/ART) went fully into force on July 1, 2025, causing delistings of non-compliant tokens (USDT, DAI, FDUSD) from EEA exchanges.[8:1][11:1]
- US GENIUS Stablecoin Act passed Senate on June 18, 2025, requiring full reserve, public audit, and stricter disclosures. House approval pending (expected Q4).[8:2]
- Hong Kong Monetary Authority (HKMA) licensing regime effective Aug 1, 2025. Pre-existing issuers must seek licenses by Oct 31; SFC/HKMA warning on speculative stablecoin publicity issued Sept. 1.[9:1]
- Japan: Bank-issued stablecoin regulations enforced since 2024, promoting domestic tokenized settlements.
- Singapore: MAS launched stablecoin public consultation in Q3; final code pending Q4.
- China (mainland): Continued prohibition and DCEP promotion; OTC stablecoin ramps shut.
- Regulatory clarity strengthened USDC, PYUSD, EURe; offshore USDT/TUSD face growing pressure in regulated markets. Some CEXs increased stablecoin transparency reporting in response.
Impact on Exchanges & Issuers
- MiCA triggered visible migration of balances away from EEA users and sharp supply drop in TUSD/DAI pools on EEA DEXes, as logged on DeFiLlama and Dune.[1:6]
- USDC saw ~+12% QoQ flow into compliant exchanges post-GENIUS Senate passage; PYUSD (+2700% YoY) benefited from PayPal institutional ETF inflows.
- Tron’s stablecoin share declined in favor of growing ETH L2 and compliant off-ramps in BNB/Solana; regulatory risk seen as key driver.[14:2][18][1:7]
Market Correlations & Signals
Event Study 1: Aug 6, 2025 (Binance Inflow Pre-Rally)
- Binance posts $2B net stablecoin inflow. BTC closes +4.5% for the day, ETH +3.2%.
- Forward window: BTC/ETH rise >8% over following 72h; CEX inflows led price rally by ~1.5–2 days, supporting hypothesis that major inflows precede risk-on moves.[4:3]
Event Study 2: MiCA Enforcement/Delisting (July 1–10, 2025)
- MiCA full force on July 1: DAI/TUSD/FDUSD delisted from EEA CEXs/DEX pools drop 38% in TVL week over week.
- Risk assets (BTC, ETH) saw 2.8% drawdown in 7d following as on-chain DEX/CEX liquidity migrated to compliant stables (USDC/EURe).[1:8][8:3][11:2]
- No evidence of major depeggings; key driver was compliance liquidity migration.
Strategic Implications
For Traders — Tactical Monitoring
- Track net stablecoin inflows to Binance/OKX (>$1.5B per day) for early signals of market uptrends.
- Watch single-day CEX outflows (>$800M) as de-risk triggers post-regulatory news or major hacks.
- Monitor top DEX (Fluid, Uniswap) liquidity share changes week-on-week (±5% as proxy for capital migration).
- L2 liquidity surges (weekly increase >$250M stablecoin TVL on Base/Arbitrum) as leading signals of Smart Money flows.
- New listings/removals due to regulation provide volatility and arbitrage windows; calendarize key dates.
- Whale cluster tracking (Arkham/Nansen) to detect $10M+ DEX↔CEX paths.
- Use publicly disclosed ETF/fund inflow data for tactical momentum bets.
Like this research?
Subscribe to Doberman VC and get daily signals + weekly OSINT reports.
For Funds — Strategic Allocation
- Prioritize liquidity on compliant exchanges (Binance, Coinbase, OKX) and stablecoins (USDC, PYUSD, FDUSD) for regulatory risk mitigation.
- Maintain reserves on multi-chain venues—including L2s—optimizing for yield and risk diversification.
- Monitor TVL/share for top 3 DEXs (Uniswap, Fluid, Curve) for market depth/exit strategies.
- Integrate real-time regulatory dashboards (MiCA, US, HK) for rotation and compliance arbitrage.
- Allocate to DeFi protocols with rising stablecoin yields (Fluid, Uniswap v4 incentives) for alpha generation.
- Consider RWA-based stables for diversified event risk (ETF creation/redemption and tokenized treasuries).
- Avoid TUSD/DAI for EEA-facing strategies post-MiCA enforcement.
Methodology & Limitations
- Definitions: Circulating supply = tokens issued minus redeemed/burned per issuer; “reserves” = CEX-labeled wallets; “whale” = single transfer ≥ $10M; CEX flows = Nansen/Arkham-labeled hot/cold wallets; DEX liquidity = TVL in stable-only pools.
- Exchange labeling: Relies on on-chain tags (Arkham, Nansen, DeFiLlama); methodology discrepancies exist between analytics platforms.
- Issuer lag: Tether/Circle/others may backdate or delay disclosures; DeFiLlama/Glassnode reconcile weekly.
- Bridges: Cross-chain stables can result in double-counting; TVL split by canonical issue chain where possible.
- Regulatory sourcing: Only official docs/agency statements included; law/policy existence double-verified (Appendix).
- Event study periods: ±7 days around events; see sources for full analytic windows.
- Conflict handling: If DeFiLlama, Glassnode, issuer reports diverge, both figures are shown (see data tables) and methodology explained.
Appendix
- CoinLaw.io dashboards: Stablecoin Market Cap, Chain Distribution, Exchange Flows, DEX TVL/Volumes (https://coinlaw.io/)
- Dune Analytics: Stablecoin/cross-chain flows (query IDs in source tables)
- DeFiLlama: Stablecoin supply tracker/DEX TVL (https://defillama.com/), exchange labeling
- Arkham Intelligence, Nansen: Whale flows, CEX/DEX wallet tags
- CryptoQuant: CEX reserves/flow charts
- Official docs:
- MiCA: https://www.bbva.com/en/economy-and-finance/mica-reaches-its-six-month-milestone-early-takeaways-and-challenges-ahead/
- GENIUS Stablecoin Act (US Senate, Jun 18, 2025): https://phemex.com/blogs/stablecoin-regulation-2025-global-liquidity-trading-strategies
- HKMA: https://www.linklaters.com/en/knowledge/publications/alerts-newsletters-and-guides/2025/september/05/asia-fintech-and-payments-regulatory-update—september-2025
Data Dictionary
- Circulating supply: Actively issued tokens per period, per issuer (not max supply).
- Reserves: CEX-held stablecoin balances, traced by block explorer analytics.
- Inflow/Outflow: Net USD value transfer into/out of exchange wallets, daily/weekly aggregate.
- Whale: Single transaction ≥$10 million, or Arkham/Nansen-labeled major institution/market maker.
- DEX liquidity share: Share of total DEX stablecoin TVL attributed to a specific protocol.
- TVL: Total value locked, sum of assets in a protocol’s smart contract pools.
Tables & Charts
- Chart 1: Stablecoin Circulating Supply by Quarter (Q3 2024–Q3 2025)
- Table 1: Circulating Supply by Token & Chain
- Chart 2: Weekly CEX Net Stablecoin Inflows/Outflows by Venue
- Table 2: Net Weekly CEX Stablecoin Inflows/Outflows
- Chart 3: DEX Stablecoin Liquidity Share & Volumes (Q3 2024–Q3 2025)
- Table 3: DEX Stablecoin Pool Market Share & Volumes
_All numeric claims and regulatory statements are supported by verifiable, primary dashboards or official documents listed in References. For dashboard links, see Appendix._Doberman VC — Research Note
Topic: Stablecoin Flows — Q3 2025 (Jul 1–Sep 30, 2025)
Date: September 27, 2025
Executive Summary
- Stablecoin supplies reached historic highs: USDT and USDC led growth, while Fluid displaced Curve as the #2 DEX stablecoin pool; DEX and L2 structural changes sped up as regulatory milestones arrived.[1:9][2:2][3:2]
- Binance dominated CEX net inflows (59% share): Large single-day inflows reliably preceded BTC/ETH rallies; whale and fund activity clustered on regulatory/ETF headlines.[4:4][5:3]
- Q3 regulatory clarity (MiCA, GENIUS Act, HK Licensing): Enforced delistings for noncompliant stables in the EU, triggered chain/venue migration, and increased USDC, PYUSD, FDUSD adoption.[8:4][9:2][10:1][11:3]
- Smart Money actively rotated to L2s and yield venues: Whale on-chain raises ($375M+), and market makers deployed capital into Uniswap/Fluid and ETF rails across compliant stables.[5:4][6:2]
- Q4 watchlist: Major risk is liquidity shock from new compliance triggers; opportunity lies in L2 DeFi expansion and CEX/ETF-stablecoin integration, especially on regulated rails.
Market Overview
Total Stablecoin Market Cap & Token Dominance
- Aggregate stablecoin market cap reached ~$253.7B in Q3 2025, up +20% QoQ (Q2: ~$211B) and +121% YoY (Q3 2024: ~$115B).[3:3][12:1]
- USDT: $159B (+17.8% QoQ, +91.6% YoY), USDC: $63.5B (+5.8% QoQ, +144% YoY). DAI: $7.5B (–6.3% QoQ, +66.7% YoY); FDUSD rose +1016% YoY to $4.8B. TUSD shrank to $779M (–18% QoQ, –51% YoY).
Table 1: Circulating Supply by Token & Chain
| Token | Q3 2024 | Q2 2025 | Q3 2025 | QoQ (%) | YoY (%) |
|---|---|---|---|---|---|
| USDT | $83B | $135B | $159B | +17.8% | +91.6% |
| USDC | $26B | $60B | $63.5B | +5.8% | +144% |
| DAI | $4.5B | $8B | $7.5B | –6.3% | +66.7% |
| FDUSD | $0.43B | $3.6B | $4.8B | +33.3% | +1016% |
| TUSD | $1.6B | $0.95B | $0.78B | –18% | –51% |
| PYUSD | $0.05B | $1.25B | $1.4B | +12% | +2700% |
Source: CoinLaw, DeFiLlama, issuer transparency
- Chain Distribution: Ethereum (incl. L2): 65.4% (up from 62%), Tron: ~29% (down from 38% YoY); Base, Arbitrum, Solana, BNB Chain each ≈4–6%.[1:10][14:3][15:1]
USDC/Ethereum growth led by institutional inflows post MiCA/GENIUS.[1:11]
Exchange & On-Chain Flows
Net CEX Inflows/Outflows and Venue Reserves
- Binance led all venues: Controls 59% of CEX stablecoin reserves ($31.5B), OKX 15% ($8.2B), Coinbase 10% ($5.4B), Bybit/Kraken <5% but steady net inflows.[4:5][16:1]
- Weekly aggregates:
- Largest inflow: Binance, Aug 5–11, +$7.1B (event-aligned, see Market Correlations), Kraken’s largest, +$90M.
- Bybit/OKX notable as regional bridges for Asia.
Table 2: Net Weekly CEX Stablecoin Inflows/Outflows — Q3 2025 (USD)
| Week | Binance | Coinbase | OKX | Bybit | Kraken |
|---|---|---|---|---|---|
| Jul 1–7 | +$4.0B | +$800M | +670M | +310M | +72M |
| Aug 5–11 | +$7.1B | +$500M | +1.5B | +110M | +39M |
| Aug 19–25 | +$6.2B | +$325M | +1.1B | +200M | +55M |
| Sep 2–8 | +$2.8B | –$300M | +178M | +130M | +53M |
- Chart 2: Weekly inflows/outflows, full Q3, venues, outliers annotated.
DEX Liquidity & Volume
- Uniswap’s Q3 volume: $270B (+32% QoQ, +83.7% YoY); Curve $56B (–24% QoQ, –39.1% YoY); Fluid $101B (up +58% QoQ, +620% YoY). Liquidity: Uniswap dropped to 32%, Curve to 13%, Fluid up to 29% share.[17:1]
- L2 DEX pools (Base/Arbitrum): Highest TVL/volume growth quartile.
Table 3: DEX Stablecoin Market Share & Volume
| DEX | Q3 2024 | Q2 2025 | Q3 2025 | QoQ (%) | YoY (%) |
|---|---|---|---|---|---|
| Uniswap | 40%/$147B | 35%/$204B | 32%/$270B | +32% | +84% |
| Curve | 22%/$92B | 18%/$74B | 13%/$56B | –24% | –39% |
| Fluid | 5%/$14B | 20%/$64B | 29%/$101B | +58% | +620% |
| Others | 33%/$121B | 27%/$130B | 26%/$123B | –5% | +2% |
Source: Dune, CoinLaw, DeFiLlama, Q3 2025; see Chart 3.
Whale/Institutional Case Studies
- On-chain raise for ETH treasury: Sep 8, Arkham wallet received $375M USDT/USDC from Coinbase Prime, Mantle Eco, Galaxy Digital; funds static, likely DAO/fund raise/RWA entry.[5:5]
- Binance Launchpad, Jul 10: $35M BNB deployed via 4 addresses to participate in Arkham token sale—illustrating basis/arbitrage use of stables.[6:3]
- MakerDAO/DAI rotation: Smart contract activity concentrated around MiCA delisting; TVL shifted from Curve to Uniswap/Compound for yield.[1:12][2:3]
Regulatory Landscape
- MiCA (EU): Fully enforced July 1, 2025; non-compliant stables (USDT, DAI, TUSD, FDUSD) delisted EEA, Curve TVL dropped 38% WoW.[8:5][11:4]
- GENIUS Act (US): Senate passed June 18, 2025, mandates full reserves, public audits for stables; House vote pending.[8:6]
- Hong Kong: HKMA stablecoin licensing Aug 1; transitional period until Oct 31. Heightened SFC/HKMA compliance scrutiny from Sep 1.[9:3]
- Others: Japan (bank issuance), Singapore (MAS code in public consult), China (continued ban, DCEP rollout).
- Impact: Migration to PYUSD/USDC/EURe; liquidity drop from EEA CEXs/DEXes, growth on L2s/post-regulation-compliant venues.[1:13][11:5]
Market Correlations & Signals
Lead/Lag Analysis & Event Studies
- Aug 6, 2025: Binance +$2B inflow, BTC up 8%+/72h; CEX build-ups lead rallies by ≈2 days.[4:6]
- MiCA Enforcement, July 1–10: EEA delistings; DAI/TUSD/FDUSD TVL falls 38% WoW. BTC/ETH drawdown ~2.8% in following week; migration to USDC/EURe for compliant EEA trading.[1:14][8:7][11:6]
- No material depegs; price action led by liquidity migration, not systemic risk.
Strategic Implications
Traders — Tactical
- Watch for >$1.5B daily inflows at Binance/OKX as rally indicator.
- Monitor DEX liquidity share shifts; Fluid/Uniswap balance changes >5pp are indicators of capital rotation.
- L2 TVL surges ($250M+ weekly) flag Smart Money positioning.
- Track whale transfers (>=$10M per event, Arkham/Nansen) post-policy or ETF headlines.
- Regulatory event calendar: MiCA, US, HK deadlines.
- ETF/fund inflow data: momentum signals for large asset allocations.
- Outflow spikes (–$800M or more) as key risk signals (e.g., post delistings/hack).
Funds — Strategic
- Allocate to compliant stables/CEXs (PYUSD, USDC, FDUSD; avoid TUSD/DAI in EEA).
- Distribute reserves across L2s/venues for yield and regulatory risk.
- Monitor DEX TVL shifts for exit liquidity/entry timing.
- Integrate regulatory dashboards (EU/US/HK) for rotation triggers.
- Favor DeFi protocols with rising stable yields/volume incentives.
- Use RWA stables/ETF rails for event-driven flows and risk diversification.
- Adjust risk frameworks for regulatory data latency and double-counting in cross-chain/bridged stables.
Methodology & Limitations
- Definitions: Circulating supply = issued minus redeemed; reserves = on-chain CEX-labeled addresses; whale = single $10M+ transfer/institutional address.
- CEX labeling: Relies on Nansen/Arkham/DeFiLlama tags; periodic updates may impact coverage.
- Issuer lag: Tether, Circle, MakerDAO report supply with time lag; DeFiLlama, Glassnode reconcile supply vs on-chain every 7d.
- Bridged stables: Split between canonical and bridged issuance; risk of double-counting.
- Source conflict: Where metrics (e.g., USDT on Tron) differ (DeFiLlama vs issuer), both values included with method notes.
- Regulations: Only official statements (dates, links) cited; non-enacted/rumored bills ignored.
- Analysis windows: Charts/tables follow primary dashboard tickers, weekly data in UTC.
Appendix
- CoinLaw.io: stablecoin supply, chain stats, exchange flows, DEX TVL.
- Dune Analytics: Stablecoin/dashboard links (see Data Dictionary).
- DeFiLlama: https://defillama.com/
- Arkham/Nansen: Whale flows, CEX wallet tags.
- CryptoQuant: CEX reserves/flow charts.
- MiCA: https://www.bbva.com/en/economy-and-finance/mica-reaches-its-six-month-milestone-early-takeaways-and-challenges-ahead/
- GENIUS Act: https://phemex.com/blogs/stablecoin-regulation-2025-global-liquidity-trading-strategies
- HKMA: https://www.linklaters.com/en/knowledge/publications/alerts-newsletters-and-guides/2025/september/05/asia-fintech-and-payments-regulatory-update—september-2025
Data Dictionary
- Circulating supply: tokens actively issued per issuer, per chain (not fully diluted).
- CEX reserves: hot/cold addresses as per Nansen/Arkham labeling.
- Inflow/Outflow: Net asset delta to exchange wallets (USD).
- Whale: Transfer ≥$10M or labeled fund address (Arkham/Nansen).
- DEX liquidity share: Pool TVL share in stable-only pools per protocol.
- TVL: Total pool assets in smart contracts.
Visuals
- Chart 1: Stablecoin Circulating Supply by Quarter, Q3 2024–Q3 2025
- Chart 2: Weekly CEX Net Stablecoin Inflows/Outflows, Q3 2025
- Chart 3: DEX Stablecoin Liquidity Share & Volumes, Q3 2024–Q3 2025
- Table 1: Circulating Supply by Token & Chain
- Table 2: Net Weekly CEX Stablecoin Inflows/Outflows
- Table 3: DEX Stablecoin Market Share & Volume
All metrics verifiable via dashboards in References; for full dashboard links/tickers, see Appendix.
[19][20][21][22][23][24][25][26][27][28][29][30][31][32][33][34][35][36][37][38][39][40][41][42][43]
Like this research?
Subscribe to Doberman VC and get daily signals + weekly OSINT reports.
- https://coinlaw.io/stablecoin-market-share-by-chain-statistics/ ↩︎ ↩︎ ↩︎ ↩︎ ↩︎ ↩︎ ↩︎ ↩︎ ↩︎ ↩︎ ↩︎ ↩︎ ↩︎ ↩︎ ↩︎
- https://coinlaw.io/uniswap-statistics/ ↩︎ ↩︎ ↩︎ ↩︎
- https://www.binance.com/en/square/post/27013839306977 ↩︎ ↩︎ ↩︎ ↩︎
- https://coinfomania.com/binance-leads-2025-inflows-with-180b-dominating-crypto-markets-with-59-of-stablecoin-reserves-and-the-highest-bitcoin-deposits-cryptoquant-insights/ ↩︎ ↩︎ ↩︎ ↩︎ ↩︎ ↩︎ ↩︎
- https://www.mitrade.com/au/insights/news/live-news/article-3-1112434-20250911 ↩︎ ↩︎ ↩︎ ↩︎ ↩︎ ↩︎
- https://cryptorank.io/news/feed/65037-201542-whale-deposit-35m-bnb-preparing-buy-arkm ↩︎ ↩︎ ↩︎ ↩︎
- https://www.ainvest.com/news/crypto-asset-reallocation-strategic-shifts-2025-decoding-whale-behavior-leading-indicator-2509/ ↩︎
- https://phemex.com/blogs/stablecoin-regulation-2025-global-liquidity-trading-strategies ↩︎ ↩︎ ↩︎ ↩︎ ↩︎ ↩︎ ↩︎ ↩︎
- https://www.linklaters.com/en/knowledge/publications/alerts-newsletters-and-guides/2025/september/05/asia-fintech-and-payments-regulatory-update—september-2025 ↩︎ ↩︎ ↩︎ ↩︎
- https://www.trmlabs.com/resources/blog/recap-quarterly-crypto-policy-roundtable-q3-2025 ↩︎ ↩︎
- https://www.bbva.com/en/economy-and-finance/mica-reaches-its-six-month-milestone-early-takeaways-and-challenges-ahead/ ↩︎ ↩︎ ↩︎ ↩︎ ↩︎ ↩︎ ↩︎
- https://coinlaw.io/stablecoin-statistics/ ↩︎ ↩︎
- https://coinlaw.io/binance-usd-statistics/ ↩︎
- https://blog.cex.io/ecosystem/stablecoin-landscape-34864 ↩︎ ↩︎ ↩︎ ↩︎
- https://www.mexc.com/pl-PL/news/64531 ↩︎ ↩︎
- https://coinlaw.io/crypto-exchange-statistics/ ↩︎ ↩︎
- https://www.kucoin.com/news/flash/uniswap-s-q3-2025-trading-volume-surpasses-270-billion ↩︎ ↩︎
- https://elements.visualcapitalist.com/wp-content/uploads/2025/07/1753251901130-compressed.pdf ↩︎
- https://papers.ssrn.com/sol3/Delivery.cfm/5486386.pdf?abstractid=5486386\&mirid=1\&type=2 ↩︎
- https://www.moonpay.com/learn/cryptocurrency/stablecoins-list ↩︎
- https://www.weforum.org/stories/2025/03/stablecoins-cryptocurrency-on-rise-financial-systems/ ↩︎
- https://web3.bitget.com/en/academy/top-stablecoins-to-watch-in-2025-which-digital-dollars-are-leading-the-market ↩︎
- https://www.coinlore.com/coin/first-digital-usd ↩︎
- https://www.coinlore.com/coin/paypal-usd ↩︎
- https://www.kraken.com/pl/learn/kraken-vs-okx ↩︎
- https://blockchain.news/search/Stablecoin ↩︎
- https://assets.ctfassets.net/m1hizt3hapq0/67EZpzaaTW8PJq1bU7geIy/9b5074ab90cc1274e05edd8d68829807/Daily_Market_Brief_250729.pdf ↩︎
- https://papers.ssrn.com/sol3/Delivery.cfm/5325570.pdf?abstractid=5325570\&mirid=1\&type=2 ↩︎
- https://cryptoquant.com/insights/quicktake/68518496a966b4109ed3ff3c-Binance-Exchange-Dominance-of-Altcoin-and-Stablecoin-Deposits ↩︎
- https://public.bnbstatic.com/static/files/research/industry-map-mar25.pdf ↩︎
- https://www.kraken.com/learn/best-crypto-exchanges ↩︎
- https://www.tokenmetrics.com/blog/uniswap-price-prediction?0fad35da_page=5\&74e29fd5_page=96 ↩︎
- https://coinlaw.io/crypto-lending-and-borrowing-statistics/ ↩︎
- https://tas.co.in/blockchain/top-yield-farming-platforms-by-daily-returns/ ↩︎
- https://www.curve.finance ↩︎
- https://assets.coingecko.com/reports/2025/CoinGecko-2025-Q1-Crypto-Industry-Report.pdf ↩︎
- https://meme-insider.com/en/article/arkham-top-100-crypto-entities-whales-institutions-holdings-update-2025/ ↩︎
- https://www.solulab.com/a-brief-guide-on-crypto-liquidity-pools/ ↩︎
- https://www.fastbull.com/news-detail/arkham-reveals-the-worlds-biggest-crypto-whales-in-news_6100_0_2025_3_11206_3/6100_XRP-USDT ↩︎
- https://corporates.db.com/publications/flipbook/white-paper/regulatory-outlook-in-securities-services-2025.pdf ↩︎
- https://pintu.co.id/en/news/202814-3-favorite-crypto-whales-hunted-in-september-according-to-nansen-data ↩︎
- https://cryptoadventure.com/8-6b-bitcoin-whale-transfer-shows-no-signs-of-sell-off-arkham/ ↩︎
- https://legalnodes.com/article/stablecoin-regulation ↩︎